Download free SQL Server tools from Redgate to help you search your databases, manage scripts and more.
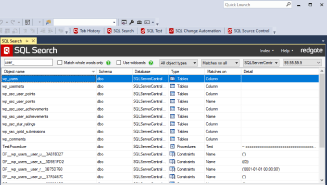
Search SQL databases in SSMS and Visual Studio. Find SQL code and navigate to it quickly, locate all references to an object, and more.
Get SQL Search for free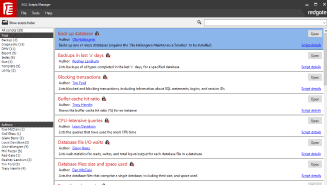
Powerful, reliable, automated scripting by SQL Server experts, for the community. Written by expert DBAs, SQL Server MVPs.
Get SQL Scripts Manager for free


